
Coordinated omission is a measurement problem that shows up in a lot of load testing setups, and it has a habit of making latency numbers look much better than they actually are. The rough idea is that when your service slows down, your load generator stops sending requests and waits, so all the requests that would have piled up during the slow period never get recorded. We end up measuring the system on its good behavior and missing most of the bad.
Our team ran into this issue the hard way. We had a load test telling us our p95 was around 350ms, but actual production data showed something closer to 1.2 seconds under similar load. We spent a decent amount of time assuming that something in the service had regressed in production, and dug around in the code for a while without finding anything that could explain a gap that large. It took us longer to realize the problem was with how our load testing was counting latency rather than with the service itself.
What Our Load Test Actually Measured
For some context on our load testing setup, we were running Locust in distributed mode using Locust Swarm, with a master process and worker processes that we could scale up or down depending on the load we wanted to generate. Generating maximum load mattered because our API sees close to 100k requests per minute at peak. On top of the volume, we have a fairly strict SLA on latency, so the tail latency was not something we could hand-wave away. A typical load test task looks something like this:
from locust import HttpUser, task

class ApiUser(HttpUser):

    @task
    def get_item(self):
        self.client.get("/items/42")
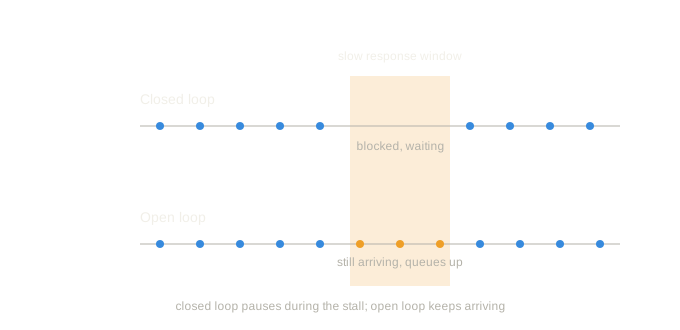
Each simulated user runs its task, waits for the response, and then goes again. This is referred to as a closed load testing model. We have a set of virtual users, and each one sends its next request once the previous response has come back, so the number of requests is capped by how fast the server responds. That coupling is the whole problem, since if the server stalls for two seconds, that user is just sitting there, blocked, and not generating any load during the exact window you most want to observe.
In the healthy case this looks fine. Requests go out at a steady pace and come back quickly.
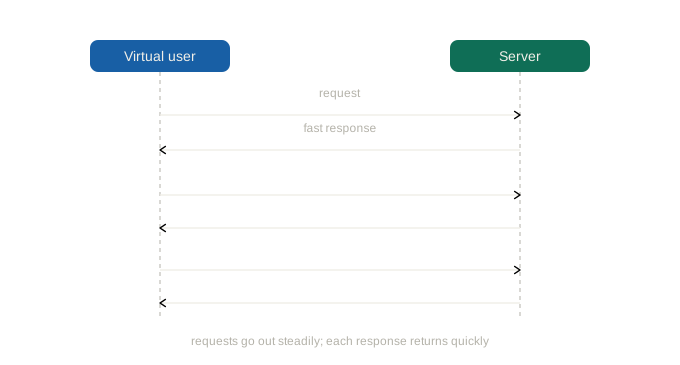
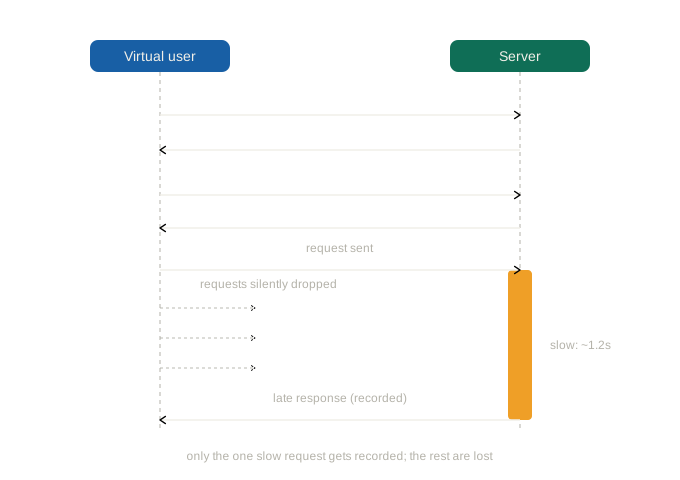
The trouble starts when one response takes much longer than the rest. Every request that a real user population would have sent during that slow window simply does not happen, because your one blocked user is waiting instead of sending. Those missing requests are the ones that would have shown high latency, so their absence is what quietly pulls the tail latency numbers down.
Why Percentiles Lie Under Coordinated Omission
The reason this matters so much for p95 specifically is that percentiles are entirely about the tail latency. p95 latency is meant to answer how bad things get for the unluckiest slice of requests. But coordinated omission removes requests in a way that is correlated with slowness, so the worse the service behaves, the more of the bad samples the setup throws away. The one slow request gets recorded as a single data point, when in reality it should have dragged a whole cluster of requests behind it, each one queued up and waiting.
That is why the existing load testing setup reports a p95 of 350ms while real request timings were sitting well past a second.
The Fix and a Note on Trusting Your Tools
The fix is to stop tying request rate to how fast the server responds, which is really the shift from a closed model to an open one. In an open model, requests arrive at a target rate regardless of whether earlier ones have finished, so if we aim for a certain number of requests per second, the generator keeps trying to hit that rate even while the server is struggling. Slow responses then cause requests to pile up rather than throttling the rate, which is much closer to how real peak traffic works, because requests keep showing up whether or not the service is having a good day. Locust supports this reasonably well through a custom load shape and by using constant_throughput or constant_pacing wait times.
from locust import LoadTestShape, HttpUser, task, constant_throughput

class SteadyArrival(LoadTestShape):
    def tick(self):
        run_time = self.get_run_time()
        if run_time < 300:
            return (500, 40)
        return None

class ApiUser(HttpUser):
    # aim for 5 requests per second per user regardless of response time
    wait_time = constant_throughput(5)

    @task
    def get_item(self):
        self.client.get("/items/42")
Locust still runs each user as a greenlet, so a single user cannot send a new request while its previous one is genuinely still in flight. constant_throughput reduces coordinated omission, but it does not fully erase it. To be truly rigorous, we pushed toward more users and more workers so that the aggregate arrival rate stays independent of any single slow response. For us, this is where scaling the worker processes up actually mattered, because at close to 100k requests per minute, a handful of workers were nowhere near enough to hold a true arrival rate once responses started slowing down.
More than the fix, the above analysis left me with a small piece of caution. It is easy to treat measurements as ground truth and spend effort explaining the system around them, but every measurement is produced by something, and that something has a behavior of its own. Every so often, the right move is to stop questioning what is being measured and start questioning the thing doing the measuring.